SEDISONIC™ - Application to emulsion stability
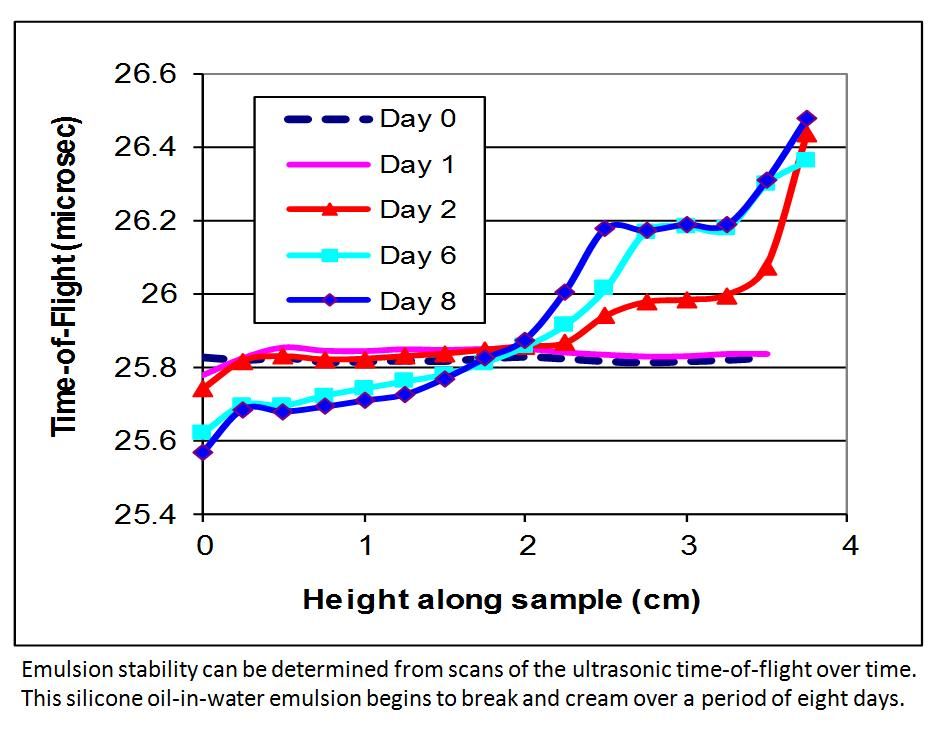
The SEDISONIC™ is very useful for determining emulsion stability. Early indication of phase separation or breakout can help dispersion manufacturers assure the shelf life of their emulsion products. As an example of emulsion breakout, this figure shows the ultrasonic scans for a silicone oil-in-water emulsion over a period of 8 days. The sample was placed in the water bath, allowed to equilibrate to 35C, scanned, and then returned to the shelf to settle further.
The settling curves for the emulsion show a uniform silicone oil concentration along the sample height on the first day. However, after just one day the time-of-flight (TOF) at the bottom of the sample has decreased, indicating a high water concentration. By the second day of settling, the emulsion has started to break out, and a higher TOF associated with the oil phase is clearly seen towards the top. A layer is starting to form at 2.5 cm from the bottom of the container, but is not visible to the eye. By the sixth day, the layer starts at 2 cm and is clearly indicated by the TOF. The oil-water layer continues to move towards the bottom of the sample as the emulsion separates. Another layer starts to form at 3.25 cm. At the same time, the concentration of water at the bottom increases steadily even though a layer is never visible.
