Calibration
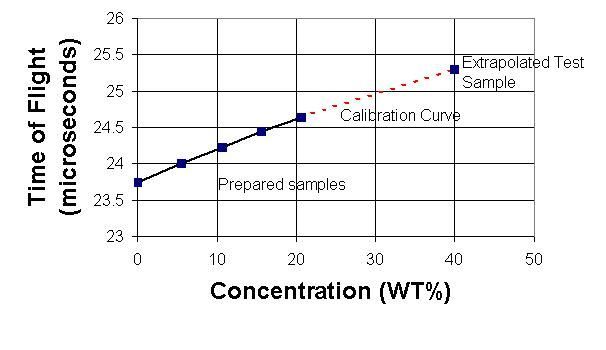
The SEDISONIC™ uses an empirical technique for developing the calibration relationship between TOF and concentration. The relationship is found by measuring the TOF for samples of known concentration and doing a curve fit to these measured values. The SEDISONIC™ software performs the curve fit and displays a plot of the curve and sample points . An example calibration plot for a polymer emulsion is shown below. Once calibrated, the program will automatically converts TOF to concentration and will displays the results graphically.
